The SaaS dashboard built into the ProAbono back office gives SaaS businesses an overview of the key metrics they need to steer their activity, such as MRR or churn rate.
Accessing the SaaS dashboard
Section titled “Accessing the SaaS dashboard”To reach the SaaS dashboard, sign in to your ProAbono back office and go to the Invoices & Payments > SaaS Dashboard section. Click the matching box to display the performance indicators, or use the direct link: open the SaaS dashboard. You can filter the data over two periods:
- Calendar year: to display the data from 1 January to 31 December of a given year.
- Rolling year: to follow performance over the last 12 months, month by month.
The key metrics of the dashboard
Section titled “The key metrics of the dashboard”The ProAbono dashboard is split into two broad categories: revenue and customers. Here are the main indicators available.
1. Revenue
Section titled “1. Revenue”- Revenue: monthly recurring revenue (MRR) and non-recurring revenue (NRR).
- Recurring: subscriptions, both fixed and variable.
- Non-recurring: one-shot invoices, setup fees and termination fees.
- Revenue evolution: a chart showing MRR gains and losses along with a net growth curve.
- MRR growth rate: the gross growth rate of MRR.
- MRR churn rate: the MRR lost to terminations.
- Net MRR growth rate: net MRR growth, that is the gross rate minus the churn rate.
2. Active customers
Section titled “2. Active customers”- Active customers: the number of customers holding an active paid subscription.
- Customer evolution: month-by-month tracking of gains and losses in active customers.
- Customer growth rate: the growth rate of new active customers.
- Customer churn rate: the churn rate of active customers, from terminated subscriptions.
- Net customer growth rate: net growth in active customers, that is the customer growth rate minus the customer churn rate.
3. Additional metrics
Section titled “3. Additional metrics”- ARPU (Average Revenue Per User): average revenue per customer per month, that is the MRR divided by the number of active customers.
- Customer lifetime: the average lifetime of a customer, estimated as the inverse of the active-customer churn rate.
- Customer lifetime value (CLTV): the lifetime value of a customer, obtained by multiplying the average customer lifetime by the average revenue per customer (ARPU).
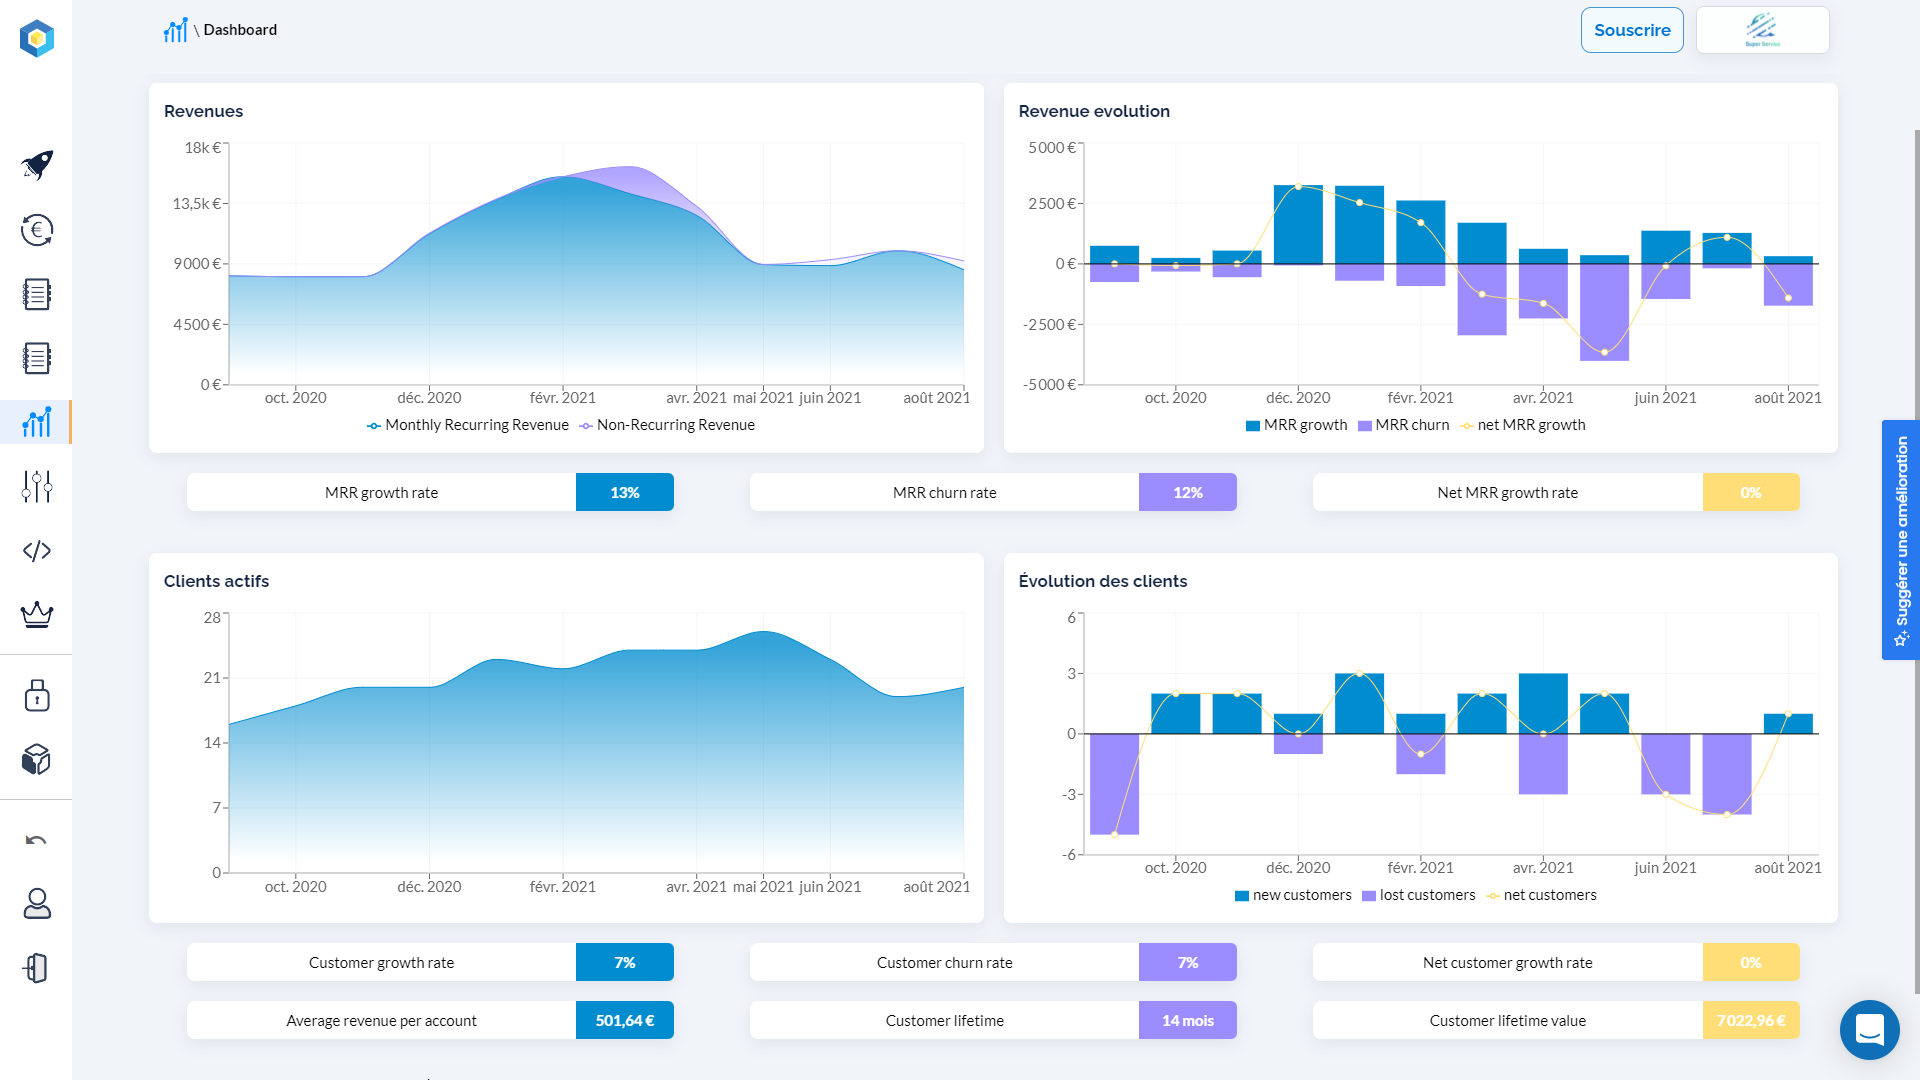
The ProAbono SaaS dashboard is built for the needs of SaaS businesses, giving a detailed and readable view of their performance indicators. Whether you are in a growth phase or looking to optimize, it supports the strategic decisions that keep your business durable and profitable.
dashboard, mrr, saas dashboard